About Life
Categories
More Information
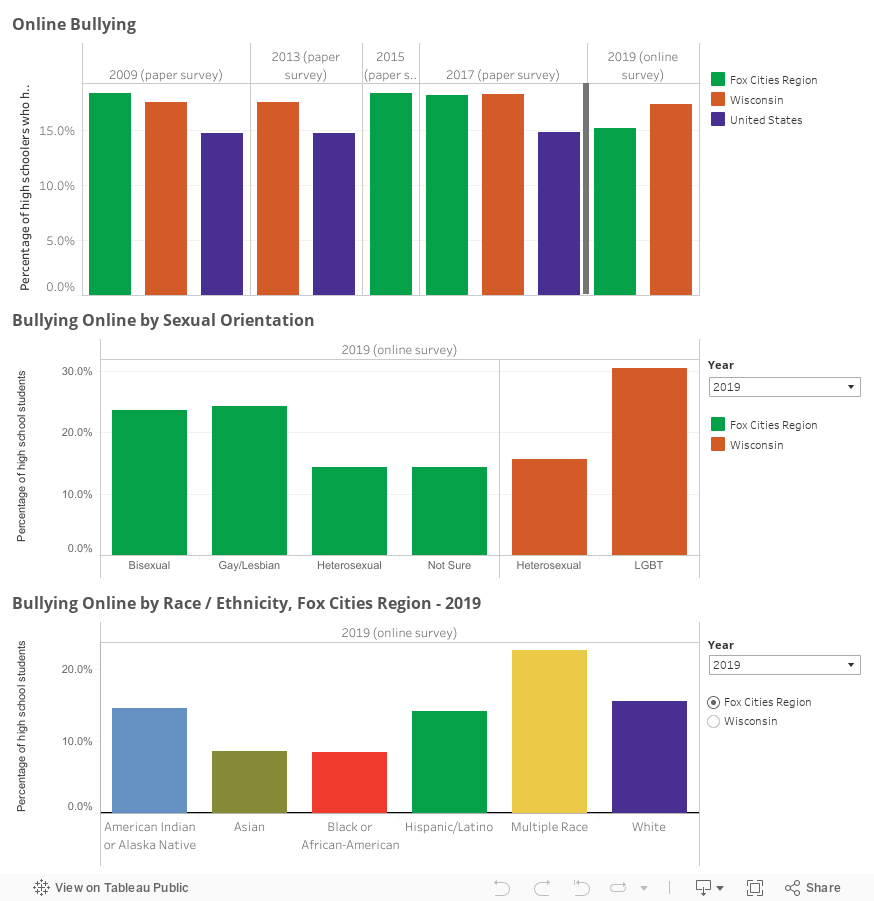
6.01 Online Bullying
This page uses data from the Wisconsin Department of Public Instruction and the U.S. Centers for Disease Control and Prevention’s (CDC) Youth Risk Behavior Surveillance System (YRBSS) to show percentages of online bullying throughout the Fox Cities Region, including breakdowns by both race and sexual preference. The YRBSS asks high school students to report if they have been electronically bullied in the past year. The YRBSS is administered by the Wisconsin Department of Public Instruction in conjunction with the CDC. The vertical gray line in the online bullying graph reflects a change in methodology from paper survey to online survey. The same change occurred for breakouts by race and sexual orientation, but isn’t as readily apparent in the graphs. The methodology change could impact the makeup of the groups responding to the survey. Restraint should be used when making yearly comparisons across this boundary line.
Sources
Wisconsin Department of Public Instruction
U.S. Centers for Disease Control and Prevention, Youth Risk Behavior Surveillance System
Notes
Regional YRBSS data contains aggregated responses from 10 school districts: Appleton, Freedom, Hortonville, Kaukauna, Kimberly, Little Chute, Neenah, Menasha, Seymour, and Shiocton. The sexual preference question was added to the YRBSS national survey in 2015, while the Wisconsin 2013 survey included this question. For 2015, only 20 states reported so incomplete data at the national level has not been included. The vertical gray line in the online bullying graph reflects a change in methodology from paper survey to online survey. The same change occurred for breakouts by race and sexual orientation, but isn’t as readily apparent in the graphs. The methodology change could impact the makeup of the groups responding to the survey. Restraint should be used when making yearly comparisons across this boundary line.