About Life
Categories
More Information

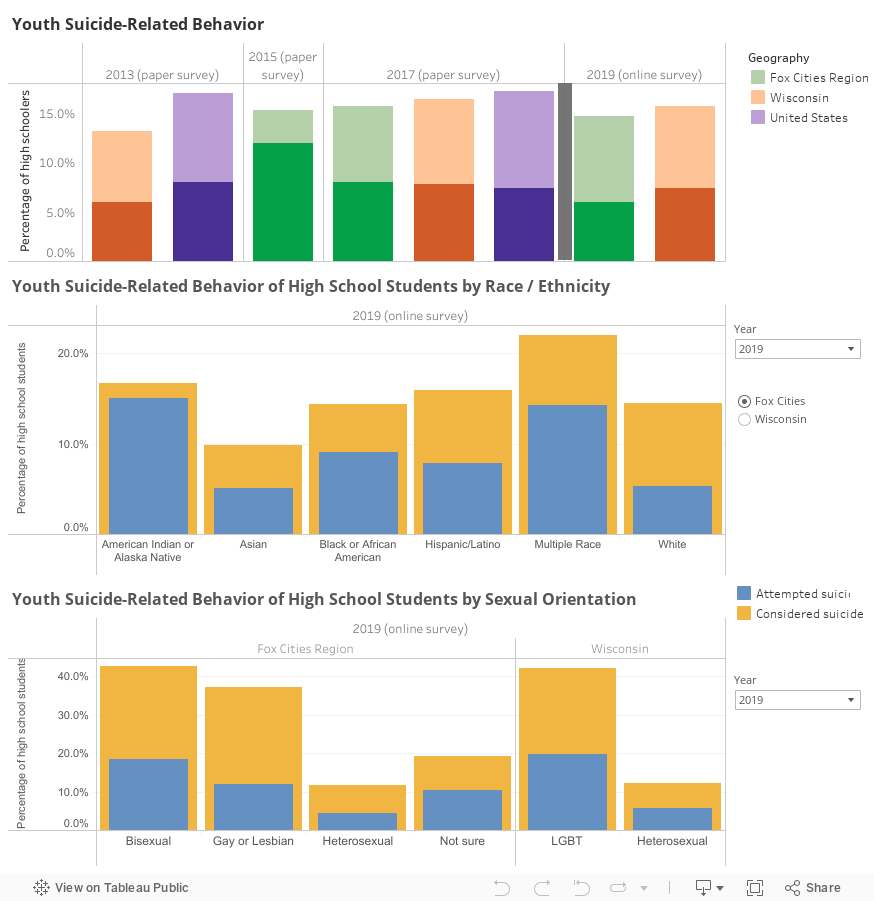
4.10 Youth Suicide-Related Behavior
This page uses data from the Wisconsin Department of Public Instruction and the U.S. Centers for Disease Control and Prevention’s (CDC) Youth Risk Behavior Surveillance System (YRBSS) to show percentages of high schoolers in the Fox Cities Region and State of Wisconsin who have either attempted suicide or seriously considered suicide in the past year, including breakdowns by both race and sexual preference. The YRBSS is administered by the Wisconsin Department of Public Instruction in conjunction with the CDC. The vertical gray line in the youth suicide-related behavior graph reflects a change in methodology from paper survey to online survey. The same change occurred for breakouts by race and sexual orientation, but isn’t as readily apparent in the graphs. The methodology change could impact the makeup of the groups responding to the survey. Restraint should be used when making yearly comparisons across this boundary line.
Sources
Wisconsin Department of Public Instruction
U.S. Centers for Disease Control and Prevention, Youth Risk Behavior Surveillance System
Notes
Wisconsin data are displayed for 2013 and Fox Cities’ regional data are displayed from 2015. Regional YRBSS data contain aggregated responses from 10 school districts: Appleton, Freedom, Hortonville, Kaukauna, Kimberly, Little Chute, Neenah, Menasha, Seymour, and Shiocton. The sexual preference question was added to the YRBSS national survey in 2015, while the Wisconsin 2013 survey included this question. For 2015, only 20 states reported so incomplete data at the national level has not been included. Hispanic student data were not available at the regional level. Note that the higher proportion of Hawaiian or Pacific Islander students who have attempted, rather than considered suicide as shown in the state and regional data is most likely attributable to an anomaly based on a small sample size.
The vertical gray line in the youth suicide-related behavior graph reflects a change in methodology from paper survey to online survey. The same change occurred for breakouts by race and sexual orientation, but isn’t as readily apparent in the graphs. The methodology change could impact the makeup of the groups responding to the survey. Restraint should be used when making yearly comparisons across this boundary line.