About Life
Categories
More Information
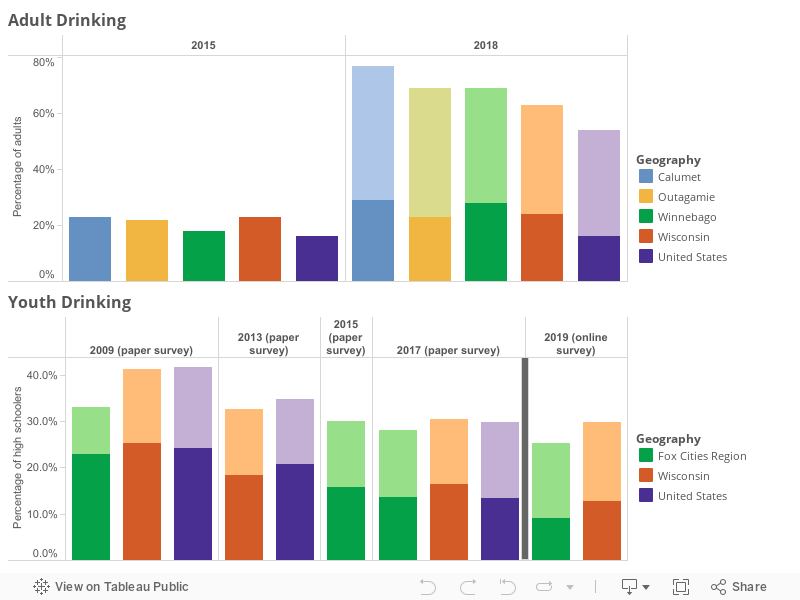
4.07 Drinking
This page includes data that provide two perspectives on alcohol consumption. The first data set, from Community Health Survey Reports of each county and the U.S. Centers for Disease Control and Prevention (CDC), includes the percentage of adults reporting in the Behavioral Risk Factor Surveillance System (BRFSS) survey that they currently drink alcohol and the percentage that currently binge drink. Adults are counted as currently drinking alcohol if they reported having at least one drink of alcohol in the past month. They are counted as binge drinkers if they reported having five or more drinks of alcohol on an occasion in the past month. The BRFSS is administered by the Wisconsin Department of Health Services in conjunction with the CDC. The second data set, from the Wisconsin Department of Public Instruction, includes the percentage of high school students reporting in the Youth Risk Behavior Surveillance System (YRBSS) survey that they currently drink alcohol and the percentage that currently binge drink. High school students are counted as currently drinking alcohol if they reported having at least one drink of alcohol in the past month. They are counted as binge drinkers if they reported having five or more drinks of alcohol within a couple of hours on at least one day in the past month. The YRBSS is administered by the Wisconsin Department of Public Instruction in conjunction with the CDC. The vertical gray line in the youth drinking graph reflects a change in methodology from paper survey to online survey. This change could impact the makeup of the groups responding to the survey. Restraint should be used when making yearly comparisons across this boundary line.
Sources
Community Health Survey Reports, Fox Valley Community Health Improvement Coalition
U.S. Centers for Disease Control and Prevention, Behavioral Risk Factor Surveillance System
Wisconsin Department of Public Instruction
U.S. Centers for Disease Control and Prevention, Youth Risk Behavior Surveillance System
Notes
The data source and all data for Adult Drinking shown on this page have been changed from previous publications in order to ensure data consistency across time.
2013 YRBSS data are used for Wisconsin and the United States where 2015 data was only available for the Fox Cities Region. Regional YRBSS data contains aggregated responses from 10 school districts: Appleton, Freedom, Hortonville, Kaukauna, Kimberly, Little Chute, Neenah, Menasha, Seymour, and Shiocton. The vertical gray line in the youth drinking graph reflects a change in methodology from paper survey to online survey. This change could impact the makeup of the groups responding to the survey. Restraint should be used when making yearly comparisons across this boundary line.